Seed Water Relations
Water uptake during seed germination investigated by NMR
Seed water uptake and ambient water potential
Hydrotime: Population based threshold model - germination dependence on water availability
Hydrotime modeling of tomato seed germination: Radicle growth and micropylar cap weakening at different water potentials
|
Water uptake during seed germination investigated by NMR
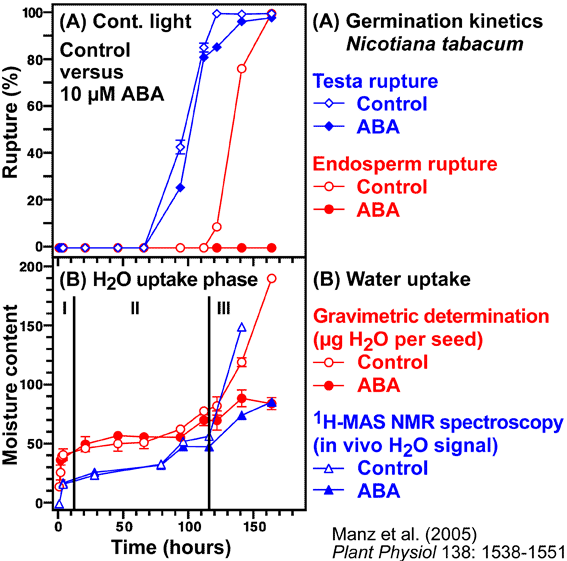
- Uptake of water by a mature dry seed is triphasic, with a rapid initial uptake (phase I, imbibition) followed by a plateau phase (phase II, metabolic preparation for germination). Phase III is a further increase in water uptake which occurs directly after germination is completed. Phase-III water uptake causes hydraulic growth of the embryo and the emerged seedling. The plant hormone ABA inhibits phase III-water uptake.
- 1H nuclear magnetic resonance (NMR) imaging is a non-invasive in vivo technique that allows the acquisition of sequential cross-sectional 2D and 3D images of the spatial distribution of 1H nuclei (protons) (Fraunhofer Institute of Biomedical Engineering - IBMT,
Dr. Frank Volke, St. Ingbert, Germany - http://www.nmr.fhg.de/home.shtm, Manz et al., 2005). 1H NMR imaging relies on the principle that 1H nuclei carry a non-zero spin and therefore a magnetic moment. NMR signals occur if these nuclei are immersed in a strong, static magnetic field and are exposed to energy delivered by a radio frequency pulse. The interaction of the magnetic moment with externally applied magnetic field gradients and radio frequencies is used to obtain two-dimensional or three-dimensional images. In cases where the resolved volume elements are finer than the resolution of the unaided human eye (approx. 0.1 mm), this method of imaging may be termed microscopic.
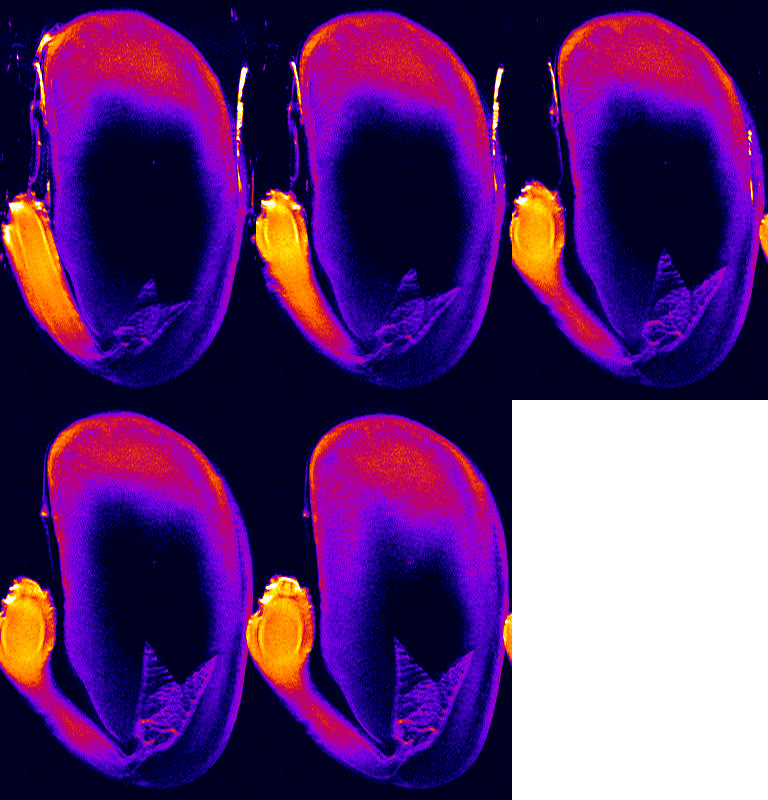
- 1H NMR imaging (MRI) and microimaging (MRM) have been used to study water uptake and flow in relatively large seeds of legumes, trees, and of cereal grains. An example for this is the germination of a bean shown below. Redistribution of water and tissue-specific differences in moisture content were detected in these seeds. Imbibition and germination of seeds as small as tobacco, i.e. < 1 mm, has been studied by NMR microimaging by Manz et al., (2005).
- We studied the regulation of water uptake of germinating tobacco (Nicotiana tabacum L.) seeds spatially and temporally by in vivo1H-NMR (Nuclear Magnetic Resonance) microimaging and 1H-MAS NMR spectroscopy (Manz et al., 2005). These non-destructive state-of-the-art methods showed that water distribution in the water uptake phases II and III is inhomogeneous. The micropylar seed end is the major entry point of water. The micropylar endosperm and the radicle show the highest hydration. Germination of tobacco follows a distinct pattern of events: rupture of the testa is followed by rupture of the endosperm. ABA (abscisic acid) specifically inhibits endosperm rupture and phase III water uptake, but does not alter the spatial and temporal pattern of phase I and II water uptake. Testa rupture was associated with an increase in water uptake due to initial embryo elongation, which was not inhibited by ABA. Over-expression of ß-1,3-glucanase in the seed covering layers of transgenic tobacco seeds did not alter the moisture sorption isotherms or the spatial pattern of water uptake during imbibition, but partially reverts the ABA inhibition of phase-III water uptake and of endosperm rupture. In vivo13C-MAS NMR spectroscopy showed that seed oil mobilization is not inhibited by ABA. ABA therefore does not inhibit germination by preventing oil mobilization or by decreasing the water holding capacity of the micropylar endosperm and the radicle. Our results support the proposal that different seed tissues and organs hydrate at different extents and that the micropylar endosperm region of tobacco acts as a water reservoir for the embryo.
"Water uptake and distribution in germinating tobacco seeds investigated in vivo by nuclear magnetic resonance imaging" by
Manz, Müller, Kucera, Volke, Leubner-Metzger, Plant Physiology 138: 1538-1551 (2005)
 |
 |
Germination of a bean studied by 1H NMR microimaging
© Fraunhofer Institute of Biomedical Engineering - IBMT
http://www.nmr.fhg.de/home.shtm
The NMR-MRI-Group of the Fraunhofer-Institute for Biomedical Engineering (IBMT)
has a long time experience and a state-of-the-art technology available to solve research
tasks for the seed industry. For more information, please visit:
http://www.nmr.fraunhofer.de
and/or contact
Dr. Frank Volke:
frank.volke@ibmt.fraunhofer.de
|
| |
 |
|
| |
 |
Germination of tobacco seed germination studied by 1H NMR microimaging
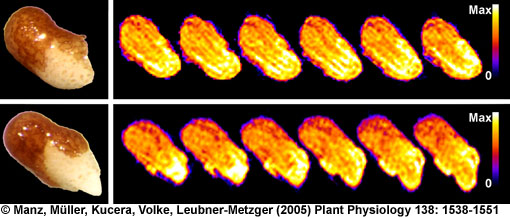
"Water uptake and distribution in germinating tobacco seeds investigated in vivo by nuclear magnetic resonance imaging" by
Manz, Müller, Kucera, Volke, Leubner-Metzger, Plant Physiology 138: 1538-1551 (2005)
|
| |
 |
"Water uptake and distribution in germinating tobacco seeds investigated in vivo by nuclear magnetic resonance imaging" by
Manz, Müller, Kucera, Volke, Leubner-Metzger, Plant Physiology 138: 1538-1551 (2005)
|

|
Seed water uptake and ambient water potential ( ) )
- Water has by definition a water potential (
 ) of 0 MPa (zero MegaPascal). The pressure unit (1 MPa = 10 bar = 1MNewton/m2) is used to characterize water potential. Leaf tissue has a water potential around - 1 MPa. The water potenial of plant tissue or of soil is determined by the sum of their pressure potential (hydrostatic pressure, turgor pressure, positive), osmotic potential (osmotic pressure, negative), and matric potential (important for dry states, negative). ) of 0 MPa (zero MegaPascal). The pressure unit (1 MPa = 10 bar = 1MNewton/m2) is used to characterize water potential. Leaf tissue has a water potential around - 1 MPa. The water potenial of plant tissue or of soil is determined by the sum of their pressure potential (hydrostatic pressure, turgor pressure, positive), osmotic potential (osmotic pressure, negative), and matric potential (important for dry states, negative).
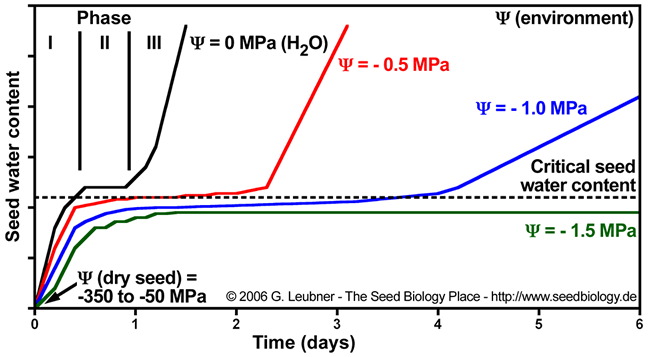
- Dry seeds usually have water potentials (
 ) between -350 and -50 MPa. This huge difference between the dry seed tissue water potential and the ambient water potential (in the case of pure water) results in rapid water influx during imbibition (phase I). Water always flows from the higher to the lower water potential and the net flux will stop if the difference in water potential becomes zero (phase II). This leads to initial radicle extension due to reversible ("elastic") growth driven by osmotic water uptake. ) between -350 and -50 MPa. This huge difference between the dry seed tissue water potential and the ambient water potential (in the case of pure water) results in rapid water influx during imbibition (phase I). Water always flows from the higher to the lower water potential and the net flux will stop if the difference in water potential becomes zero (phase II). This leads to initial radicle extension due to reversible ("elastic") growth driven by osmotic water uptake.
- Further embryo growth at and after the completion of seed germination requires cell wall loosening to allow phase III water uptake. The growth potential of the embryo and the constraining force of the endosperm and testa layers determine the completion of germination. Ambient water potential and temperature are of utmost importance for germination timing.
- Imbibition at reduced ambient water potential (
 ) lowers seed water content, extends the lenght of phase II ("activation phase"), and delays/blocks entry into phase III. Radicle emergence and growth require a critical (minimum) seed water content. Below this germination is blocked (see figure below). ) lowers seed water content, extends the lenght of phase II ("activation phase"), and delays/blocks entry into phase III. Radicle emergence and growth require a critical (minimum) seed water content. Below this germination is blocked (see figure below).

|
Hydrotime ( ): Population based threshold model - germination dependence on water availability ): Population based threshold model - germination dependence on water availability
- Population based threshold models may provide a common framework to explain ecophysiological observations of the control of seed germination by the environment (Finch-Savage and Leubner-Metzger, 2006; Bradford, Weed Science 50: 248-260, 2002; Gummerson, Journal of Experimental Botany 37: 729-741). Such descriptive population based threshold models are established and are widely used to describe the seed germination responses with relatively simple mathematical equations.
- For the hydrotime model see below. The thermal time model describes the dependence of germination on the temperature, and both models can be combined: hydrothermal time model (see webpage "Seed Modeling"). Similar models and equations describe the dependence of seed responses to other external or internal factors, e.g. ABA content, dormancy release, endosperm weakening (see webpage "Seed Modeling").
- The hydrotime model describes the dependence of germination on the water availability: At constant temperature the germination time can be calculated from the amount of water potential
 (in MPa) exceeding a base or threshold water potential (in MPa) exceeding a base or threshold water potential  (in MPa). Hydrotime (in MPa). Hydrotime  (in MPa-days) is often a constant value for all seeds of a population, but the base water potential (in MPa-days) is often a constant value for all seeds of a population, but the base water potential  varies among individual seeds in a normally distributed manner. Hydrotime varies among individual seeds in a normally distributed manner. Hydrotime  is the accumulation of MPa in excess of a base or threshold water potential, multiplied by the elapsed time to germination. The value of is the accumulation of MPa in excess of a base or threshold water potential, multiplied by the elapsed time to germination. The value of  is the total hydrotime (in MPa x h) required for each seed to complete germination. is the total hydrotime (in MPa x h) required for each seed to complete germination.
Hydrotime  (in MPa-days) = ( (in MPa-days) = ( - -  ) x time (in days) = constant value for all seeds of a population ) x time (in days) = constant value for all seeds of a population
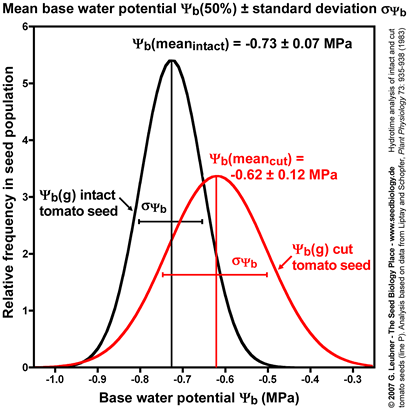
Base water potential  is often normally distributed with a standard deviation is often normally distributed with a standard deviation  among seeds in the population among seeds in the population
- The figures above are derived from germination time courses at different ambient water potentials (seed imbibition in the presence of osmotica). From these plots tg, the times to the germination percentages g (10%, 50%, 90%, etc.) can be determined. The rate of germination GRg = 1/tg decreases linearly with water potential (
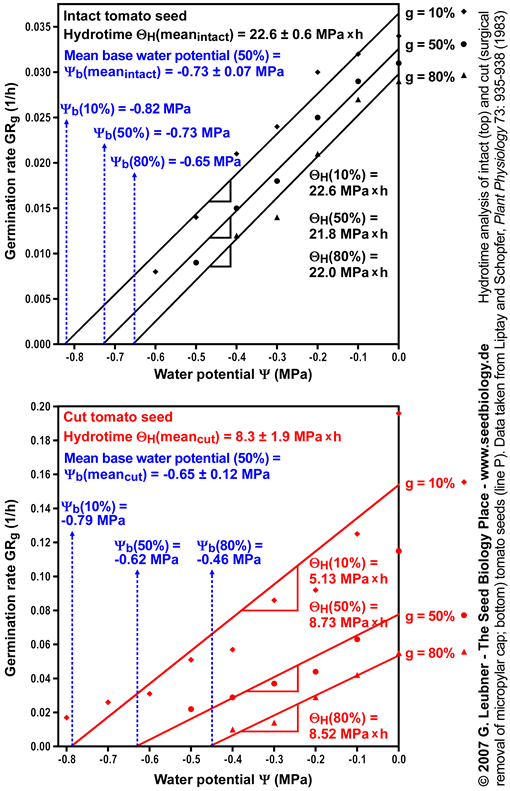
 ) to a base ( ) to a base ( ). Hydrotime ). Hydrotime  is often the same for all seeds in the population (constant slope in the left figure above), but is often the same for all seeds in the population (constant slope in the left figure above), but  (g) varies between seeds in a normal distribution with a characteristic mean (g) varies between seeds in a normal distribution with a characteristic mean  (50%) and a characteristic standard deviation (50%) and a characteristic standard deviation  ( ( ; calculated from the different ; calculated from the different  (g) values obtained; right figure above). (g) values obtained; right figure above).
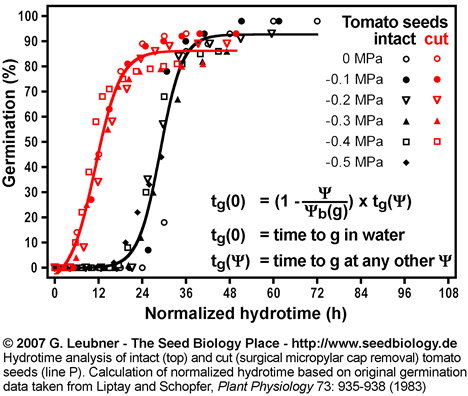
- Normalized hydrotime: Different germination curves at different waterpotentials
 with the actual time as x-axis can be transformed and plotted as one combined germination curve with normalized hydrotime as x-axis. To do this one must first determine the base water potential with the actual time as x-axis can be transformed and plotted as one combined germination curve with normalized hydrotime as x-axis. To do this one must first determine the base water potential  (g) of the seed population as described above. Based on this the normalized hydrotime (in days or hours) can be culculated by multiplication of the actual time by (1 - ( (g) of the seed population as described above. Based on this the normalized hydrotime (in days or hours) can be culculated by multiplication of the actual time by (1 - (  / / (g)). An example for this is given in the next section "Hydrotime modeling of tomato seed germination" based on results published for tomato seeds. (g)). An example for this is given in the next section "Hydrotime modeling of tomato seed germination" based on results published for tomato seeds.
Time to germination g in water tg(0) = (1 - ( / / (g))) x tg( (g))) x tg( ) with tg( ) with tg( ) = time to germination g at any ) = time to germination g at any 
- Probit hydrotime analysis: An example for this is given in the next section "Hydrotime modeling of tomato seed germination" based on results published for tomato seeds. The variation of
 (g) closely approximates a normal distribution. The probit analysis technique is achieved according to the model: (g) closely approximates a normal distribution. The probit analysis technique is achieved according to the model:
probit(g) = ( - ( - ( /tg) - /tg) -  (50)) / (50)) / 

|
Hydrotime modeling of tomato seed germination:
Radicle growth and micropylar cap weakening at different water potentials
- An example for hydrotime modeling is given in this section. Hydrotime analysis of intact and cut (surgical removal of the micropylar cap) tomato seeds (line P) was performed. The original germination data at different water potentials were taken from Liptay and Schopfer, Plant Physiology 73: 935-938 (1983).
- The left figure shows the germination time courses of intact and cut tomato seeds at different ambient water potentials
 (in MPa) . From these plots tg, the times to the germination percentages g (10%, 50%, 80%, etc., in h) was determined. These values are used to calculate the rates of germination GRg = 1/tg (in 1/h). (in MPa) . From these plots tg, the times to the germination percentages g (10%, 50%, 80%, etc., in h) was determined. These values are used to calculate the rates of germination GRg = 1/tg (in 1/h).
- The right figure shows the germination rate GRg dependence on the ambient water potentials
 for three germination percentages g. Note that GRg decreases linearly with water potential ( for three germination percentages g. Note that GRg decreases linearly with water potential ( ) to a base ( ) to a base ( ). The base water potentials for each g ). The base water potentials for each g  (g) can be determined from the intersections of the lines with the x-axis. These base water potentials (g) can be determined from the intersections of the lines with the x-axis. These base water potentials  (g) are normally distributed with a characteristic mean base water potential (g) are normally distributed with a characteristic mean base water potential  (50%) and a characteristic standard deviation (50%) and a characteristic standard deviation  (calculated from the different (calculated from the different  (g) values obtained). Note that the presented mean base water potential calculated from the intersections of the regression lines corresponds in value to the base water potential (g) values obtained). Note that the presented mean base water potential calculated from the intersections of the regression lines corresponds in value to the base water potential  (50%). (50%).
- In the right figure the hydrotimes
 can be calculated as the reverse of the slopes of the curves. Note that the presented mean hydrotime constants and standard deviations were calculated from the slopes of the regression lines for 10%, 20%, 30%, 40% 50%, 60%, 70%, and 80% g. Ideally, the slopes and therefore the hydrotimes can be calculated as the reverse of the slopes of the curves. Note that the presented mean hydrotime constants and standard deviations were calculated from the slopes of the regression lines for 10%, 20%, 30%, 40% 50%, 60%, 70%, and 80% g. Ideally, the slopes and therefore the hydrotimes  are constant for all germination percentages g. are constant for all germination percentages g.
|
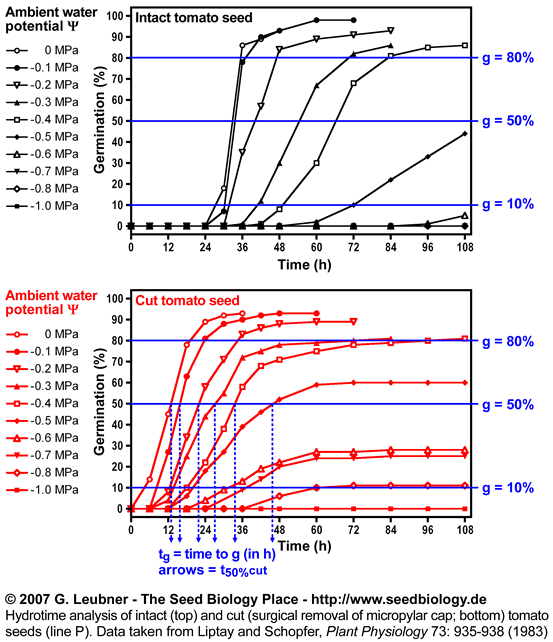
Hydrotime analysis of intact and cut (surgical removal of the micropylar
cap)
tomato seeds (line P).
Data were taken from Liptay and Schopfer,
Plant Physiology 73: 935-938 (1983) and analysed by G. Leubner
See the section above ("Hydrotime") for abbreviations and units.
|
 |
 |

|
Standard deviation of mean base water potential
|
|
- Intact and cut tomato seeds differ in their germination responses to changing ambient water potentials
 . Cut seeds have a ca. 10% higher mean base water potential . Cut seeds have a ca. 10% higher mean base water potential  (50%) and the standard deviation (50%) and the standard deviation  is ca. doubled (see figure on the left). However, cut seeds have a three-fold smaller hydrotime constant is ca. doubled (see figure on the left). However, cut seeds have a three-fold smaller hydrotime constant  (see figure above). (see figure above).
- Thus, the removal of the micropylar cap of tomato seeds confers only a small shift in the
 values at the time of radicle protrusion. The micropylar cap is therefore not a main constraint for water uptake. It is known that endosperm weakening is sensitive to changing ambient water potentials values at the time of radicle protrusion. The micropylar cap is therefore not a main constraint for water uptake. It is known that endosperm weakening is sensitive to changing ambient water potentials  . This is in agreement with the finding that cap removal lowered the hydrotime constant . This is in agreement with the finding that cap removal lowered the hydrotime constant  . .
|

|
Normalized hydrotime
- Normalized hydrotime: Once the
 (g) distribution is known for a seed batch, germination time courses at different water potentials can be normalized on a common time course equivalent to that occurring in pure water (tg(0)). This is achieved by multiplication of the actual time tg( (g) distribution is known for a seed batch, germination time courses at different water potentials can be normalized on a common time course equivalent to that occurring in pure water (tg(0)). This is achieved by multiplication of the actual time tg( ) by (1 - ( ) by (1 - (  / / (g)). See the section above ("Hydrotime") for formulas and units. (g)). See the section above ("Hydrotime") for formulas and units.
- That intact and cut tomato seeds differ in their germination responses to changing ambient water potentials
 is also evident from their different time courses based on normalized hydrotime (in h; see figure on the right). is also evident from their different time courses based on normalized hydrotime (in h; see figure on the right).
|
|
|

|
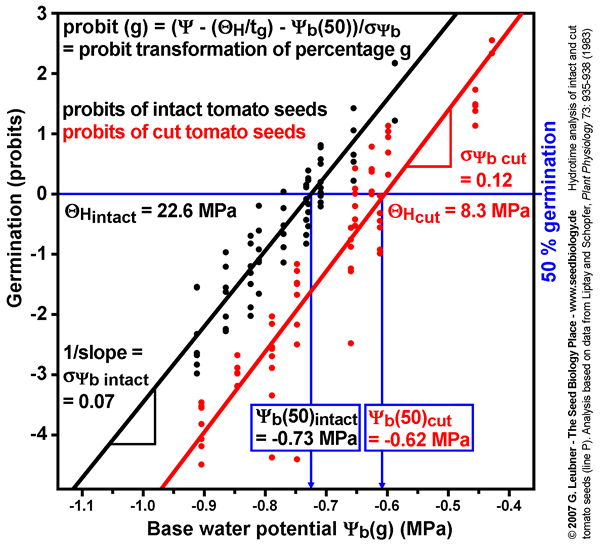
Probit analysis of water relations
|
|
- Probit analysis of tomato germination at different water potentials comparing intact and cut seeds (see figure on the left): The probit analysis technique to estimate
 , ,  (50%), and (50%), and  is described by Bradford (1995, in: Kigel and Galili (eds.) "Seed development and germination", pp. 351-396, Marcel Dekker, Inc., New York). is described by Bradford (1995, in: Kigel and Galili (eds.) "Seed development and germination", pp. 351-396, Marcel Dekker, Inc., New York).
- The probit-transformed percentages from germination time courses at different ambient water potentials are plotted as a function of
 - ( - ( /tg), which is equal to /tg), which is equal to  (g). Different values of (g). Different values of  are used in repeted probit regressions until the optimal fit to all data is obtained. are used in repeted probit regressions until the optimal fit to all data is obtained.
- The midpoint of the regression line (probit = 0, 50% germination) gives the value of
 (50%). The inverse of the slope is (50%). The inverse of the slope is  . To model germination in response to different ambient water potentials, these values are then used in the following equation to model the germination responses: . To model germination in response to different ambient water potentials, these values are then used in the following equation to model the germination responses:
probit(g) = ( - ( - ( /tg) - /tg) -  (50)) / (50)) / 
- The estimated values for
 , ,  (50%), and (50%), and  derived from the probit analysis with all data (see figure on the left) are similar to the values obtained with the above techniques. derived from the probit analysis with all data (see figure on the left) are similar to the values obtained with the above techniques.
- Probit analysis can be used to model other external and internal factors that determine germination responses. See the webpage "Seed Modeling" for examples.
|
|
| |
| |
| |
|
 |
| |
|
|
|

|


 |

