Tansley Review - New Phytologist 186: 817-831 (2010)
The evolution of seeds
Biological Sciences Department, California Polytechnic State University, San Luis Obispo, 7 CA 93401, USA (C.A.K.)
*Corresponding authors: C.A.K., G.L.-M.
Received December 21, 2009; accepted February 23, 2010; published online April 12, 2010
DOI 10.1111/j.1469-8137.2010.03249.x

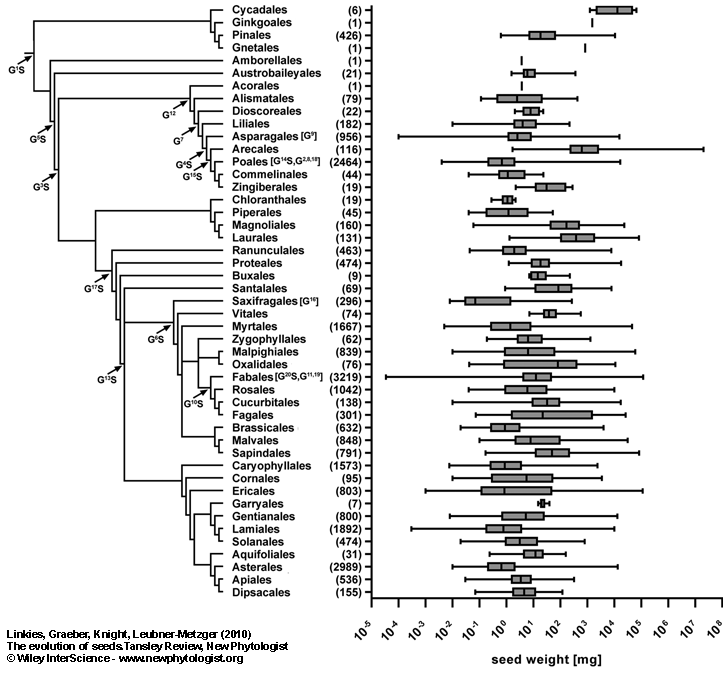
Figure 3.
Comparison of variation in seed mass of different plant species.
Shown is a phylogeny of seed plants to the order level and the corresponding seed masses are figured as whisker-box-plots. The grey boxes include 50 % of all data points for a certain order with the vertical line showing the median and the error bars indicating the range of seed masses. Numbers in round brackets indicate the number of species in the corresponding order of which seed mass data was available. Arrows in the phylogenetic tree indicate major divergence points in genome size (G) and seed mass (S). Shown are the 20 largest contributions to present-day variation in 2C DNA content ranked from 1 to 20 (superscript numbers following G) by their contribution score for genome size (Beaulieu, 2007). Major significant divergences for seed mass are shown (Beaulieu, 2007; Moles et al., 2005a). Note that often genome size and seed mass divergence points are belonging to the same node. Genome size and seed mass divergences which are within an order are shown in brackets directly behind the order’s name. All seed mass data is from Liu et al. (2008). The phylogenetic tree was constructed using Phylomatic (www.phylodiversity.net/phylomatic).
| Article in PDF format (900 KB) |
|
|
|
The Seed Biology Place |
Webdesign Gerhard Leubner 2000 |